Digital Twins and KPI Frameworks for Low-Volume, High-Mix Composite Manufacturers
What a systematic review of 42 research papers tells us about measuring what matters on an AFP shop floor — and why most composite manufacturers are flying blind.
The measurement problem nobody wants to talk about
Walk into ten composite shops running Automated Fiber Placement, and you will find ten different answers to a simple question: how is the cell performing today?
One plant tracks kilograms of tow deposited per shift. Another watches machine utilization. A third measures rework rate. A fourth has a whiteboard with hand-written cycle times that was last updated on Tuesday. The honest truth is that most low-volume, high-mix (LVHM) composite manufacturers — which is to say, almost every aerospace, space, wind, hydrogen, and defence composites shop on the planet — do not have a shared language for performance at all.
This is not a complaint unique to composites. A new systematic literature review by Wickramanayake, Matkó, Máté and Vveinhardt, published in Management Theory and Studies for Rural Business and Infrastructure Development in early 2026, put the entire LVHM manufacturing research field under a PRISMA microscope — 42 peer-reviewed papers from Scopus and Web of Science between 2021 and 2025 — and reached a conclusion that ought to make every composites operations manager uncomfortable: the field is obsessed with optimizing makespan and lead time, largely ignores digital KPIs like data quality and decision speed, and has produced almost nothing usable for early-stage manufacturers who are still figuring out how to collect data in the first place.
If you run an AFP-XS cell, an AFP-X line, or an ADDX large-format additive system, that finding should land close to home. LVHM is not a niche — it is the composites business model. And the research community has just admitted it doesn't yet have a framework for people like you.
Let's unpack what the review actually found, and then talk honestly about what it means for the way Addcomposites customers think about performance.
What LVHM actually means on an AFP shop floor
Before digging into the review, a quick grounding. "Low-volume, high-mix" is the industrial shorthand for production environments where you make many different parts in small quantities, often engineer-to-order or make-to-order, with long setup times relative to run times and a product catalogue that shifts constantly. A serial automotive line is the opposite — high volume, low mix. A composites shop building fuselage panels for a UAM prototype, a satellite tank for a space startup, and a tooling pattern for a wind-blade root insert, all in the same week, is LVHM in its purest form.
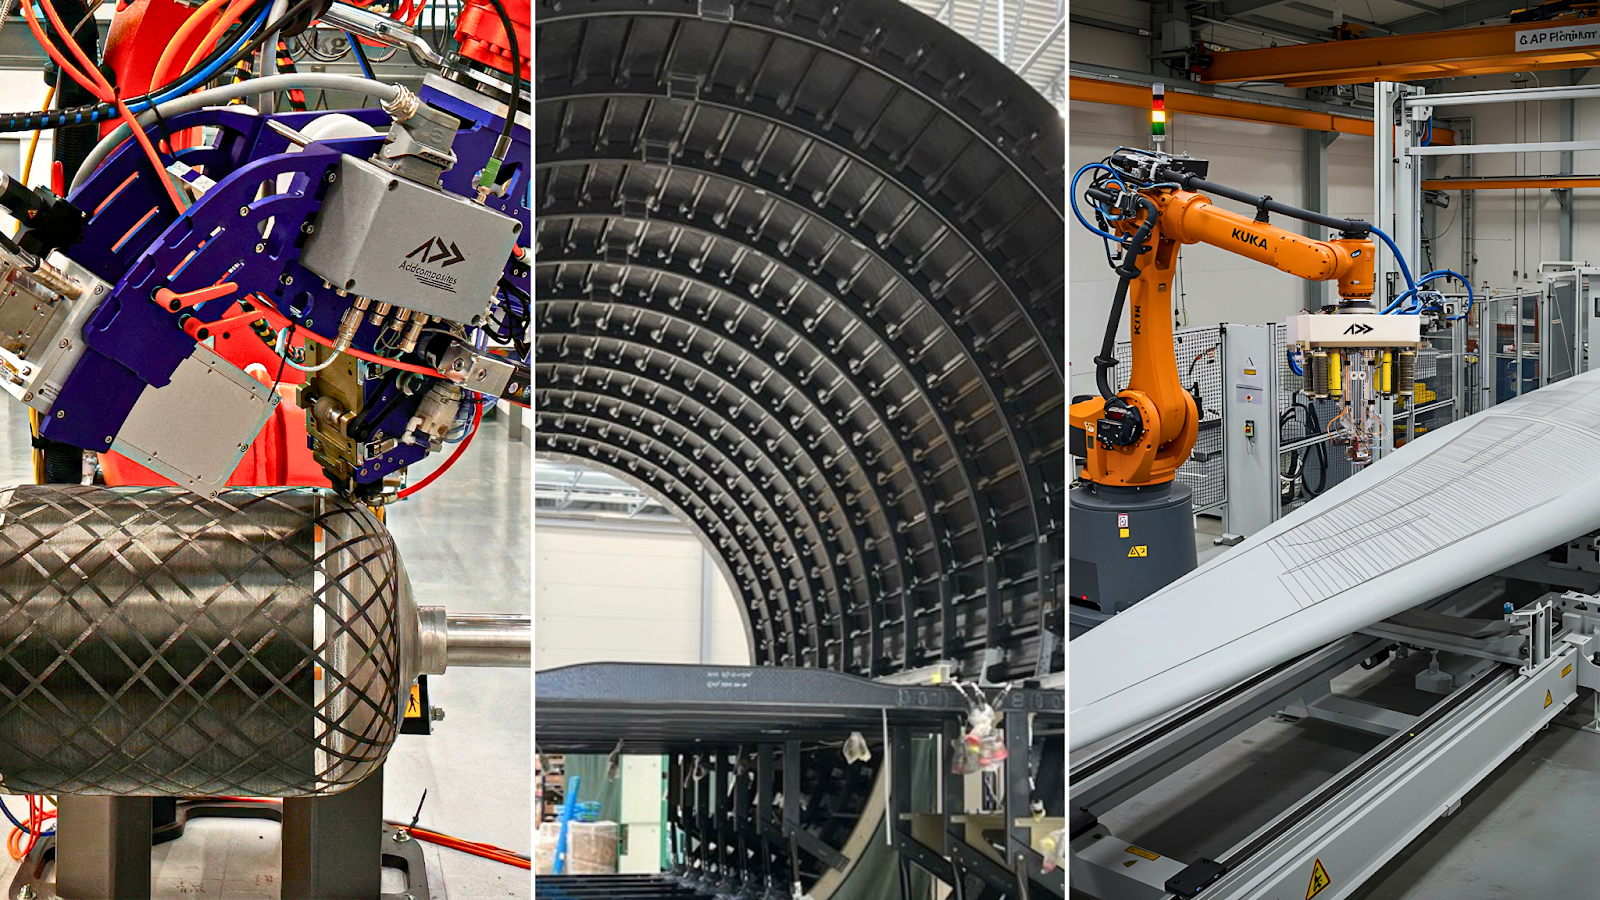
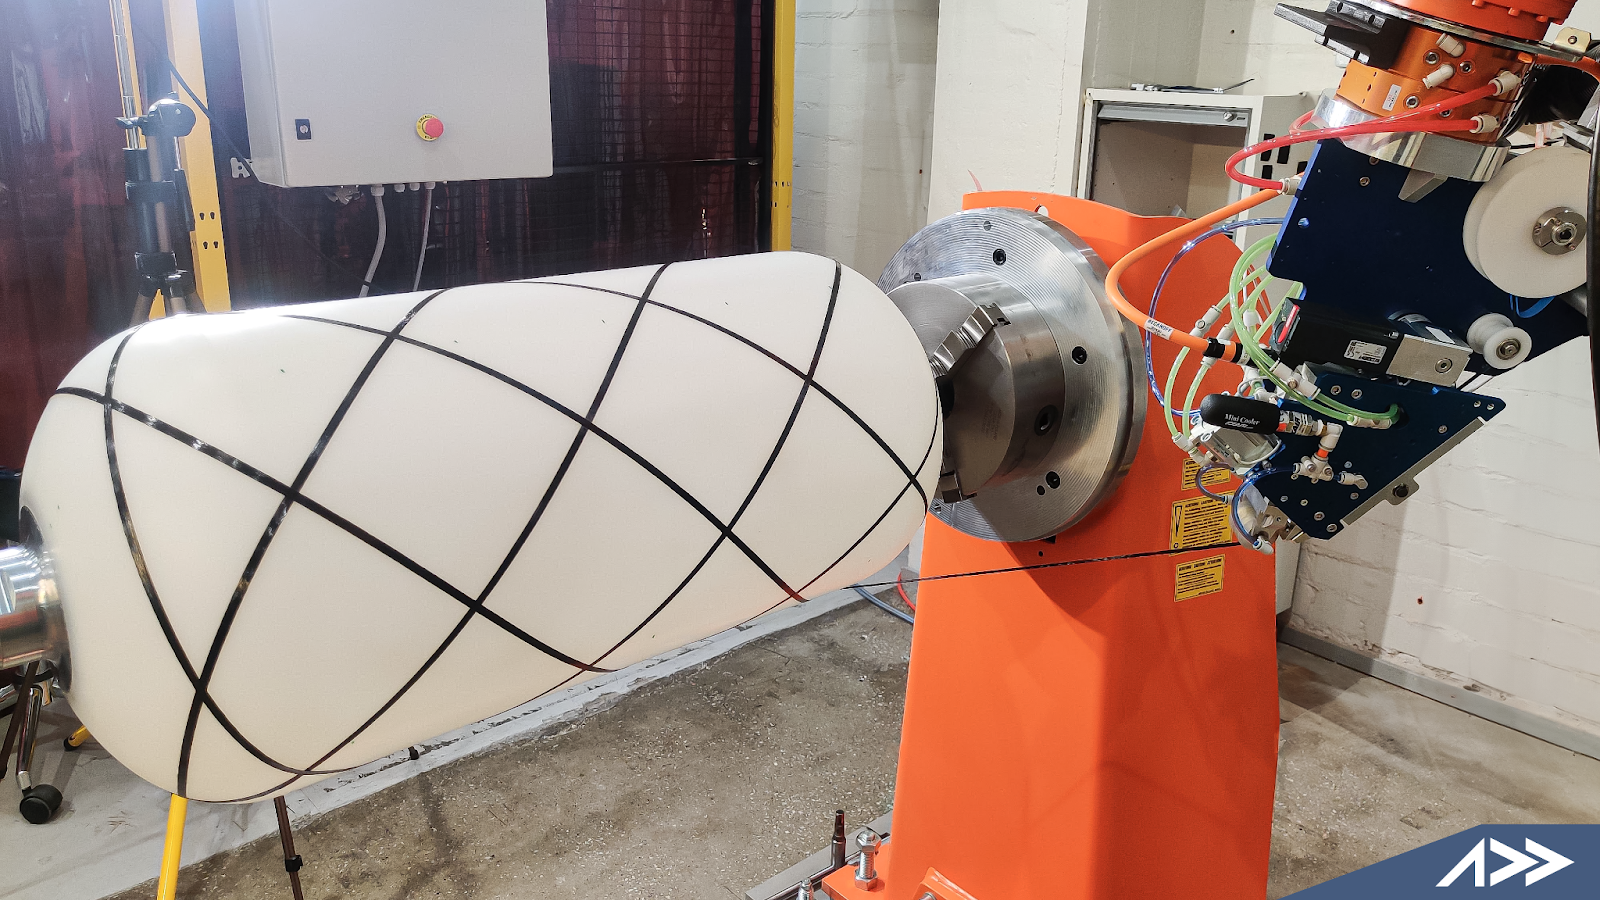
AFP-enabled composite manufacturing across pressure vessels, aerostructures, and large-format panels — the product variety that defines an LVHM shop floor.
Every characteristic that makes composites manufacturing hard — programme-to-programme tool changes, ply book revisions mid-run, thermoplastic vs thermoset campaigns on the same hardware, qualification trials running alongside production — is amplified in the LVHM corner. And every assumption built into the last century of manufacturing performance measurement was built for the other corner.
What the review actually looked at
The Wickramanayake team followed PRISMA methodology strictly. They pulled 245 candidate papers from Scopus and Web of Science, removed duplicates, screened titles and abstracts, checked introductions and conclusions, verified full-text availability, and ended with 42 papers for final synthesis. Their search string deliberately combined LVHM-flavoured terms ("job shop", "make to order", "engineer to order", "high-mix low-volume", "nonrepetitive") with data-and-measurement terms ("data-driven", "KPI", "performance metric", "dashboard", "monitoring system").
In other words: they went looking for the intersection of how LVHM shops measure themselves and what technologies they use to do it. That intersection turns out to be small, uneven, and heavily biased toward a few well-trodden paths.
That final 42 is the evidence base for everything below.
Finding 1: Time is king, everything else is rounding error
When the authors tallied which KPIs actually appeared across the 42 studies, they counted 96 KPI mentions — but only 46 distinct metrics. Different papers call the same thing different names, which by itself tells you the field lacks a shared vocabulary. More striking is which metrics dominated.
Makespan and lead time together account for roughly a quarter of every KPI mentioned in the entire literature. Throw in tardiness and throughput and you have covered most of what researchers consider "performance" in LVHM. Notice what is not in that chart: first-time-yield, scrap rate, data quality, decision latency, OEE, programme margin, or anything resembling a digital-era operational metric.
The authors are blunt about this: "there is a significant disparity between the operational and digital components of performance monitoring." For an industry that spends its conference keynotes talking about Industry 4.0, that is a damning sentence. And for composites specifically — where a single scrapped skin can wipe out a week of margin — the near-total absence of quality and cost KPIs from the published research is not a rounding error. It is a blind spot.
Finding 2: Four solution families, very different ROI stories
The review clustered the solutions used in those 42 papers into four technology families. The relative weight tells a story about where academic effort is going versus where practical value actually lives.
Where the 42 LVHM Papers Spend Their Effort
Academic investment vs. practical deployment reality
Forty percent of the field is chasing reinforcement learning, deep Q networks, graph attention networks and ensemble learners. Another quarter is tuning NSGA-II, particle swarm and genetic algorithms. Only fourteen percent of the literature looks at the thing that actually helps a production supervisor on Monday morning: a framework built on accessible tools that the team can run without a data scientist.
The review drives this home with a specific contrast. On one end you have work like Ding et al. (2025) using a hierarchical multi-policy soft actor-critic reinforcement learning algorithm — scientifically impressive, but requiring GPU-level compute, large training datasets, and specialist ML expertise to deploy. On the other end you have Patil et al. (2024), who built a production scheduling system for a small manufacturer using nothing more than Microsoft Excel and Power BI, and reported clearly improved decision-making and lead-time visibility. Same problem domain. Radically different accessibility.
The authors rated every paper for "startup applicability." The result is one of the most honest diagrams in the review:
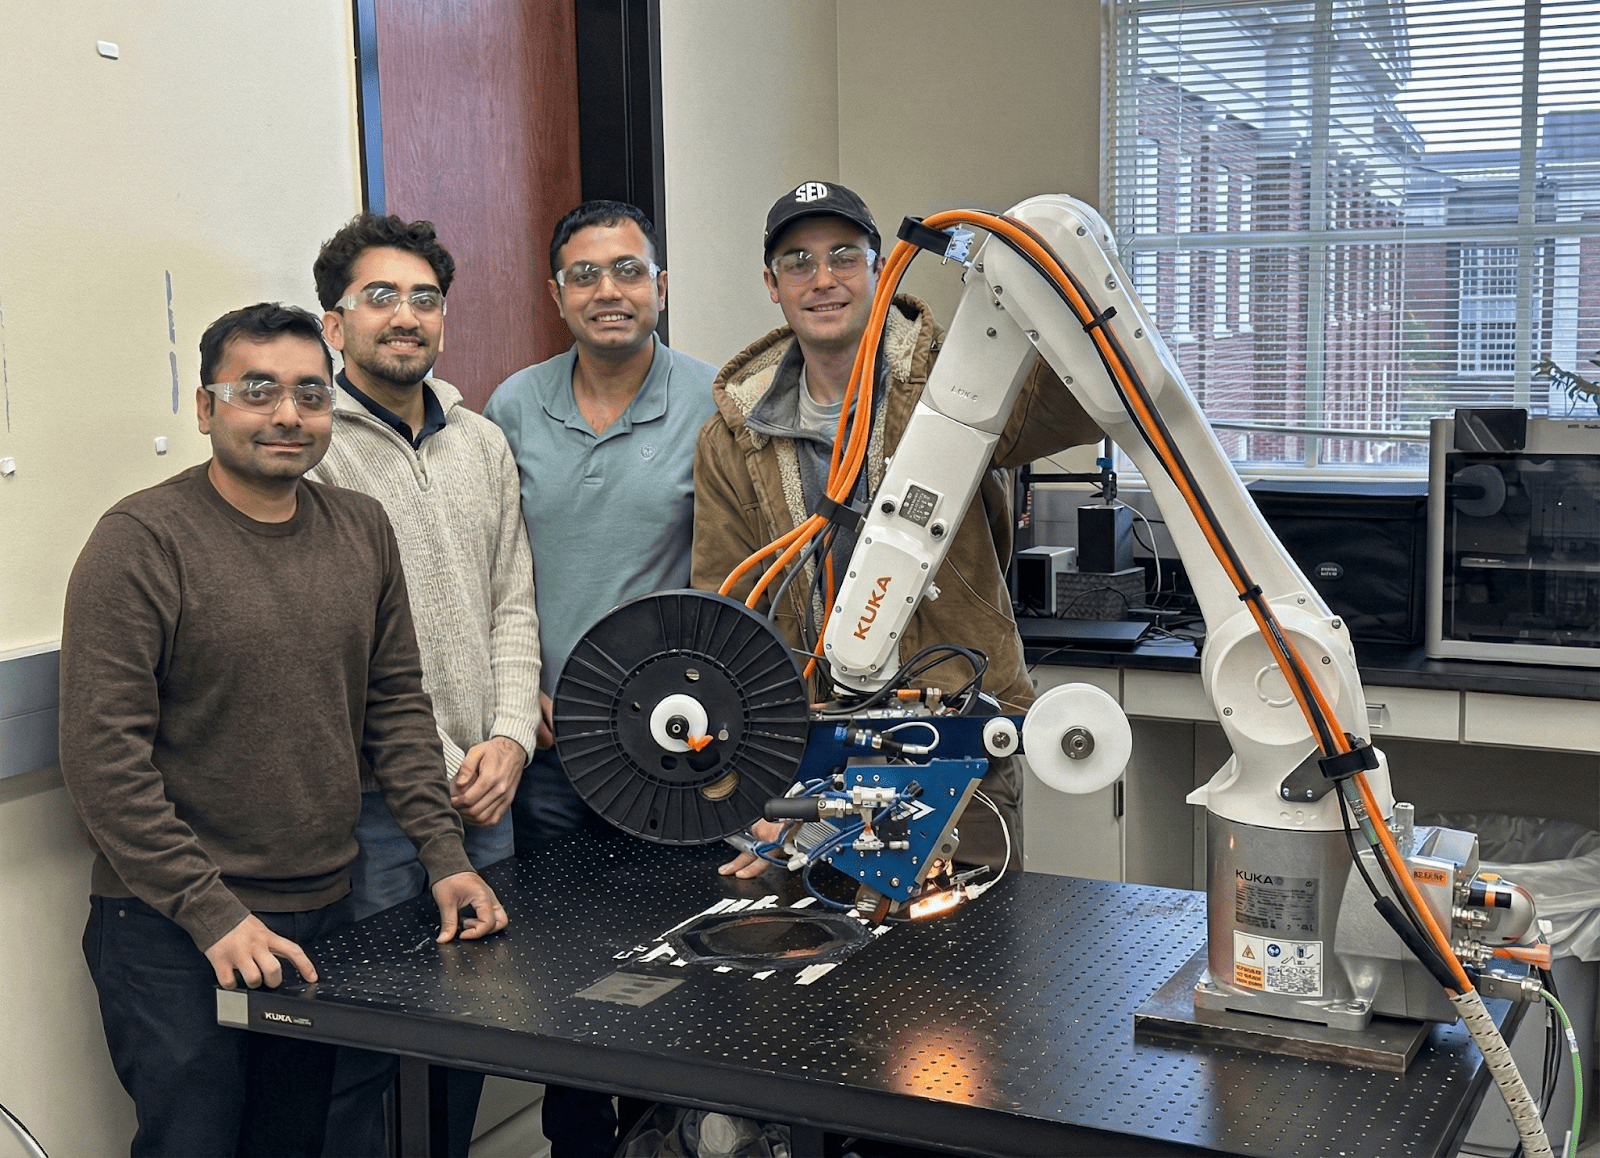
A university research team operating AFP-XS at AMSL, University of Alabama — compact, portable, and capable of thermoset and thermoplastic processing.
Finding 3: Digital twins are crossing from hype to ROI
Here is where the composites story gets genuinely interesting. Among the four solution families, simulation and digital twins are the category that most cleanly links real shop-floor data to real KPI outcomes — the thing the paper says we are otherwise missing.
The standout example in the review is Sit and Lee (2023), who built a Digital Twin Production Optimisation System (DTPOS) specifically for low-volume, high-mix job allocation and scheduling. The reported result: average order processing time dropped from 19 days to 9.59 days, a 52.63% reduction, while maintaining on-time completion performance. Miqueo et al. (2023) reported 24% and 22% improvements in component stock and milkrun utilisation from discrete-event simulation of multi-model assembly lines. Ghaleb et al. (2021) showed average cost savings of approximately 27% from integrated production-scheduling and maintenance-planning using a hybrid genetic algorithm coupled to a real maintenance model.
These are not marginal wins. They are the kind of numbers that change a business case.
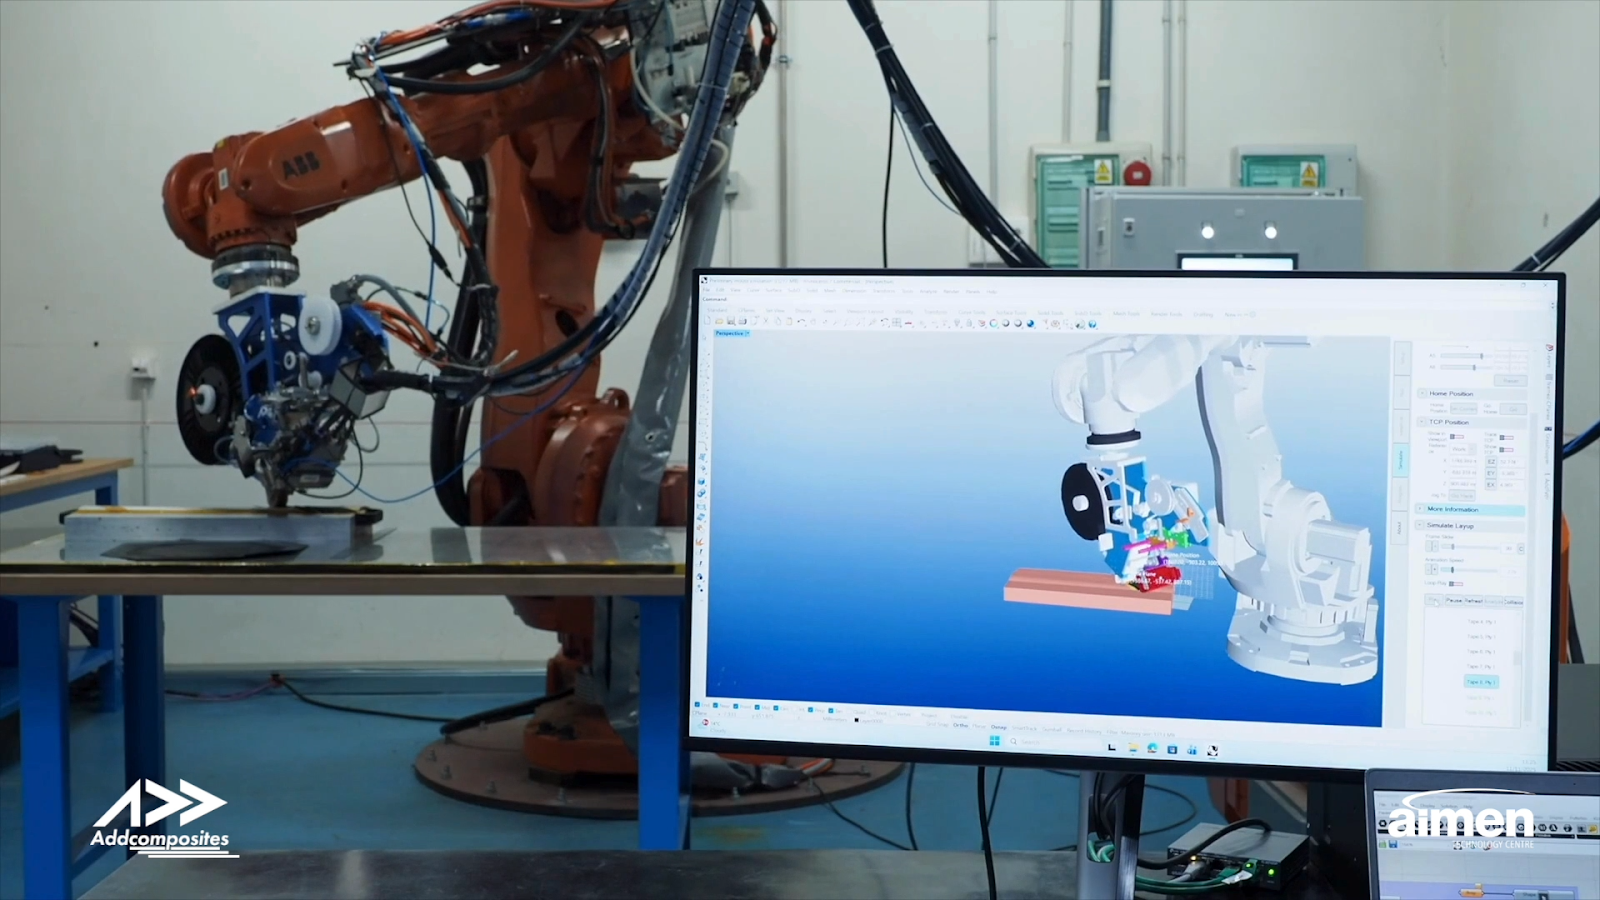
The physical AFP cell and its AddPath digital twin — side by side. Credit: Addcomposites / AIMEN Technology Centre.
The critical insight from the review is why digital twins work where pure ML does not. A digital twin starts from the data infrastructure — the shop floor, the machine, the process — and layers decision support on top of it. Reinforcement learning, by contrast, treats the KPI as an optimization target and needs clean, abundant historical data before it can say anything useful. In LVHM composites, clean abundant historical data is the thing you do not have.
Reported Improvements from the Simulation / DT Cluster
Independent studies showing consistent, repeatable gains
Finding 4: The startup gap is the biggest gap
The most uncomfortable finding in the review is this: across 42 papers, not one study explicitly addresses LVHM performance measurement for manufacturers in the early stage of operations. Every single piece of research assumes a developed, operationally established context with built-in data infrastructure, structured process documentation, and an existing performance measurement culture.
Carbon fibre pressure vessel layup with AFP-XS.
That assumption quietly excludes an enormous share of the real composites industry — including most of the customers Addcomposites works with. A space startup building its first cryo tank. A drone manufacturer scaling from 10 to 100 airframes a year. A new entrant qualifying a thermoplastic workflow. A research centre standing up a hydrogen pressure vessel line. None of them fit the profile of the "mature shop" the literature silently assumes.
Literature Assumptions vs. LVHM Composite Reality
What 42 papers assume — and what the factory floor actually looks like
- Clean historical data
- Stable SOPs
- Dedicated ML team
- Cyber-physical infrastructure
- Stable product mix
- Reliable takt time
- Sparse, noisy data
- SOPs still forming
- 1–3 process engineers
- Laptop + MES if lucky
- Mix changes monthly
- Programme-driven takt
The review explicitly calls out the need for "measurement models tailored for early-stage firms" and argues that new enterprises should not defer performance evaluation while waiting for better tools. The research-backed conclusion is uncomfortably simple: start with a small set of essential indicators measurable with basic instruments, and grow the framework as your data infrastructure matures.
What this means for an AFP shop floor
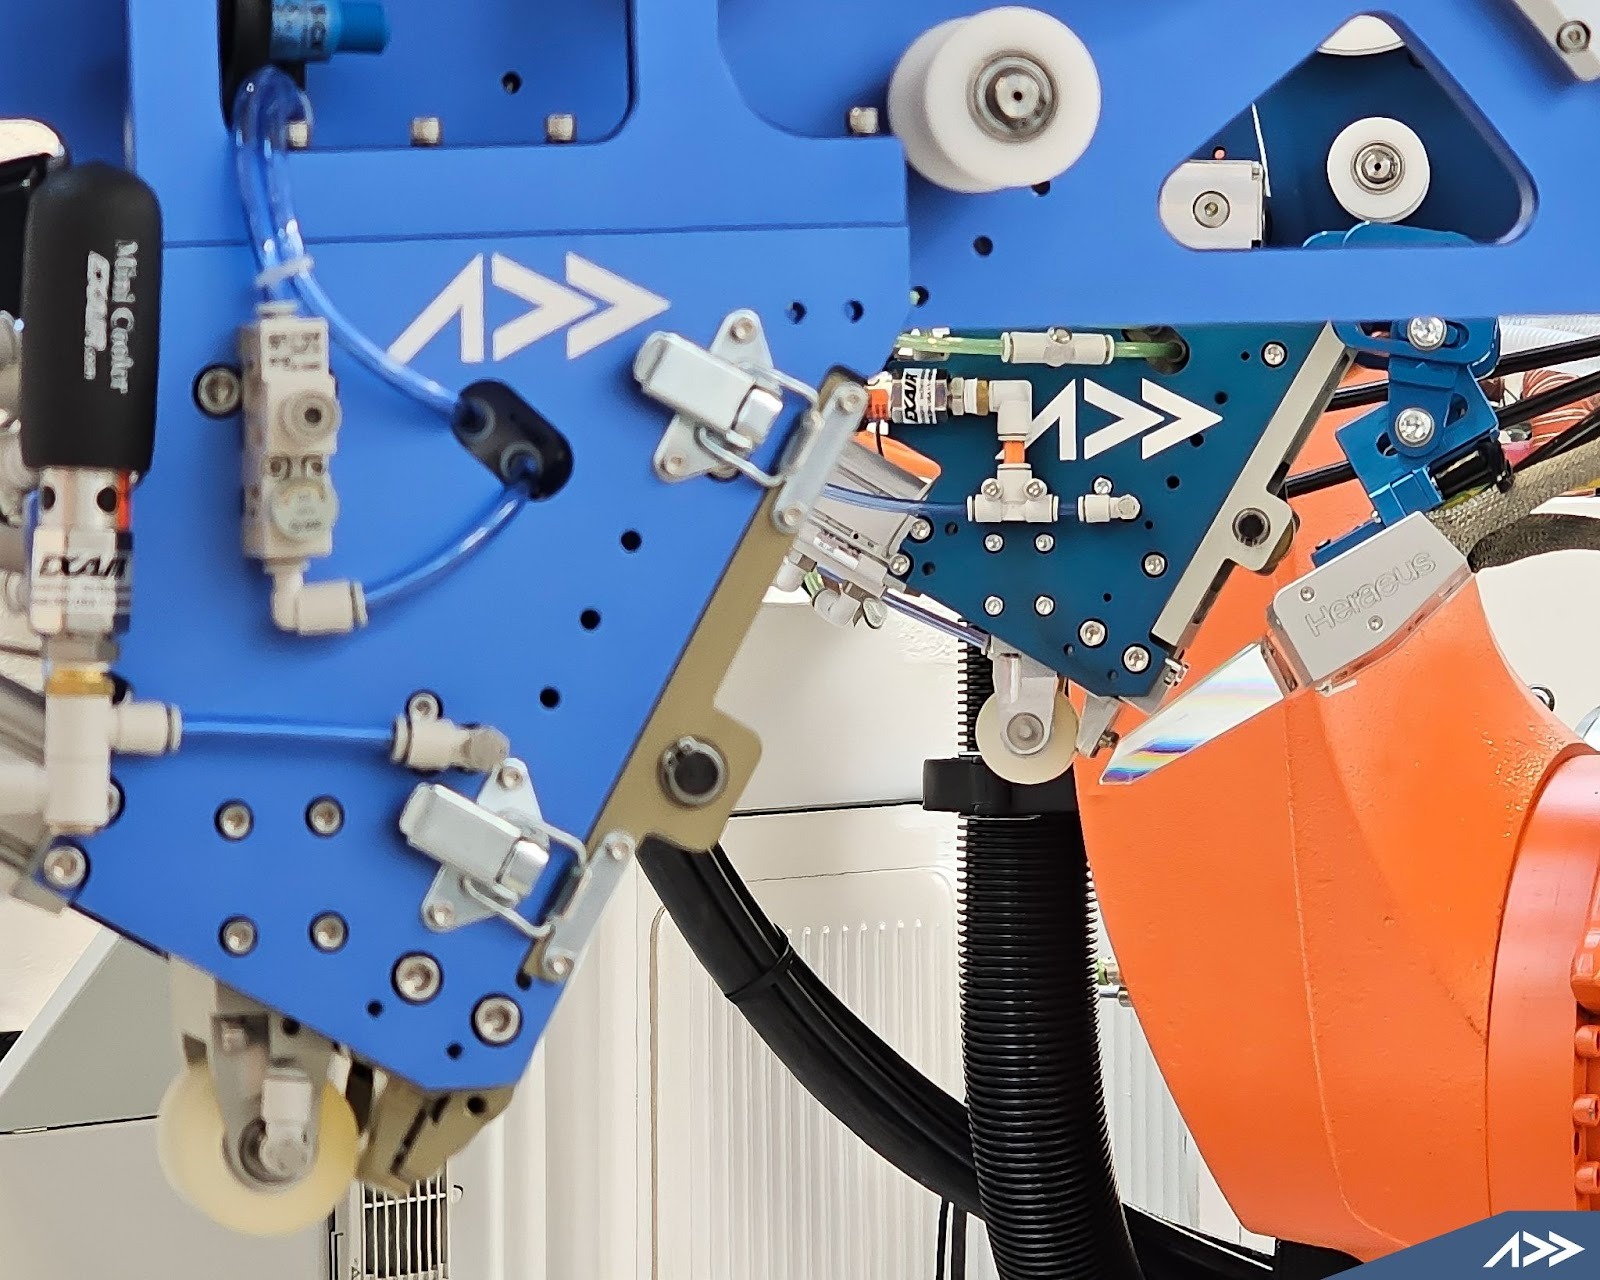
Here is where the review stops and where practical composite manufacturing starts. AFP systems — whether an AFP-XS running thermoset prepreg, an AFP-X depositing thermoplastic tape, or an ADDX extruding polymer and fibre in parallel for large-format additive — generate data continuously. Tow tension, head speed, compaction force, heating zone temperatures, tape feed state, layup path progress, machine alarms, ply completion events. Every one of these is a candidate input to a digital twin or a KPI dashboard.
The question is not whether the data exists. It is whether anyone is turning it into decisions.

AddPath generating AFP toolpaths — process data converting directly into layup decisions.
Map the review's findings onto a composites cell and a practical picture emerges:
The Accessible LVHM KPI Stack for an AFP Cell
What the research says actually works
Layer 1 is the physical reality, and it is the same in every composite shop. Layer 2 is where most LVHM manufacturers get stuck — data is being produced, but it is trapped in controllers, spreadsheets, and people's heads. Layer 3 is where the Wickramanayake review tells us the biggest opportunity lives: a small, well-chosen set of KPIs that survive the leap from lab paper to shop floor. Layer 4 is the payoff — not a speculative RL agent, but practical decision support that a production manager can actually run.
The research is also clear about which path gets you there fastest. Patil et al.'s Excel-plus-Power-BI approach is rated "directly usable" by the review. A full cyber-physical digital twin deployment is rated "medium — requires investment but high ROI." Reinforcement learning scheduling is rated "low — not realistic for resource-constrained environments." The ranking does not mean you should never build a digital twin. It means you should build the KPI framework first, then layer the twin on top of data you are already collecting.
Why this matters specifically for Addcomposites customers
Addcomposites has spent eight years making AFP accessible to manufacturers who never thought they could afford it. Fifty-plus installations of AFP-XS around the world, a subscription model that keeps capital barriers low, AddPath running on Rhino and Grasshopper so that the software feels familiar to anyone already working in CAD. The whole product philosophy has been: democratize composites, start with what the customer actually has, grow the capability from there.
The Wickramanayake review, without knowing it, is making the exact same argument for performance measurement. Start with accessible KPIs. Use the tools you already own. Instrument the cell incrementally. Layer in simulation and eventual digital twin capability as the data matures. Do not wait for a perfect Industry 4.0 stack before you start measuring, because the research evidence says the perfect stack never arrives and the companies that wait for it fall behind the ones that ship a Power BI dashboard on a Friday afternoon.
Every AFP-XS customer is already sitting on a data stream that could feed a lead-time KPI within a week. Every AFP-X customer running thermoplastic campaigns has the inputs to compute a meaningful kg/hr deposition rate and a first-time-yield trend. Every ADDX user printing large-format parts can track build time variance, nozzle-hour utilization, and energy per kilogram. None of this requires reinforcement learning. All of it is what the review says the industry is missing.
The Accessibility Ladder the Research Validates
The research says Stage 1 is where the real gains live, because most LVHM manufacturers skip it entirely and then wonder why their Stage 4 projects fail.
Three honest takeaways
Start with what you have
The academic literature is not going to hand you a framework. Start with lead time, makespan, first-time-yield, deposition rate, scrap cost — define them for your context, and measure them with whatever tools you already own.
Digital twins have a clean ROI story
A 53% reduction in order processing time, 27% cost savings from integrated scheduling, 22% improvements in flow time — repeatable results across multiple independent studies. When the AFP cell already generates process data, a digital twin is the natural next step.
The gap is the opportunity
The review explicitly identifies early-stage LVHM manufacturers as the most underserved segment in performance measurement research. That segment is exactly who Addcomposites has been building for since 2016.
Boring is achievable
You do not need a reinforcement learning agent. You need a Monday morning KPI review, a dashboard you trust, and the discipline to let it grow with your data. That is an Industry 4.0 story worth telling.
The measurement problem on the composites shop floor is real, the research community has just confirmed how real it is, and the path forward is more boring and more achievable than most people think. You do not need a reinforcement learning agent. You need a Monday morning KPI review, a dashboard you trust, and the discipline to let it grow with your data.
That is an Industry 4.0 story worth telling.
Learn More
Get in touch to discuss your AFP digital twin and KPI framework application →
Contact Us for a ConsultationReferences
- Wickramanayake P. S. D., Matkó A., Máté D., Vveinhardt J. (2026). Performance Measurement in LVHM Manufacturing: KPIs, Technologies, and Startup Gaps. Management Theory and Studies for Rural Business and Infrastructure Development, Vol. 48, No. 1, pp. 51–66. DOI: https://doi.org/10.15544/mts.2026.06. Open access under CC BY-NC 4.0.
- Sit, M. & Lee, C. K. M. (2023). Digital Twin Production Optimisation System (DTPOS) for LVHM job allocation and scheduling. Reported 52.63% reduction in average order processing time (19 days to 9.59 days). Cited in Wickramanayake et al. (2026).
- Ghaleb, M., et al. (2021). Integrated production-scheduling and maintenance-planning using a hybrid genetic algorithm. Reported approximately 27% average cost savings. Cited in Wickramanayake et al. (2026).
- Miqueo, A., et al. (2023). Discrete-event simulation of multi-model assembly lines. Reported 24% and 22% improvements in component stock and milkrun utilisation. Cited in Wickramanayake et al. (2026).
- Patil, R., et al. (2024). Production scheduling for small manufacturers using Microsoft Excel and Power BI. Rated "directly usable" by Wickramanayake et al. (2026) for resource-constrained environments.
- Ding, Y., et al. (2025). Hierarchical multi-policy soft actor-critic reinforcement learning algorithm for LVHM scheduling. Rated "not realistic for resource-constrained environments" by Wickramanayake et al. (2026).
- Yang, Z. (2025). Average flow time reduction study in LVHM manufacturing context. Cited in Wickramanayake et al. (2026).
- Addcomposites — AFP-XS, AFP-X, ADDX, and AddPath product documentation. https://www.addcomposites.com
