What Does an AFP Machine Actually Cost? A Full TCO Breakdown for SMEs
AFP machines range from €3,500/month to €5M+ upfront. Here's the honest TCO breakdown — including what legacy vendors don't tell you about rework, labour, scrap, and hidden integration costs.
The Conversation That Kills AFP Projects Before They Start
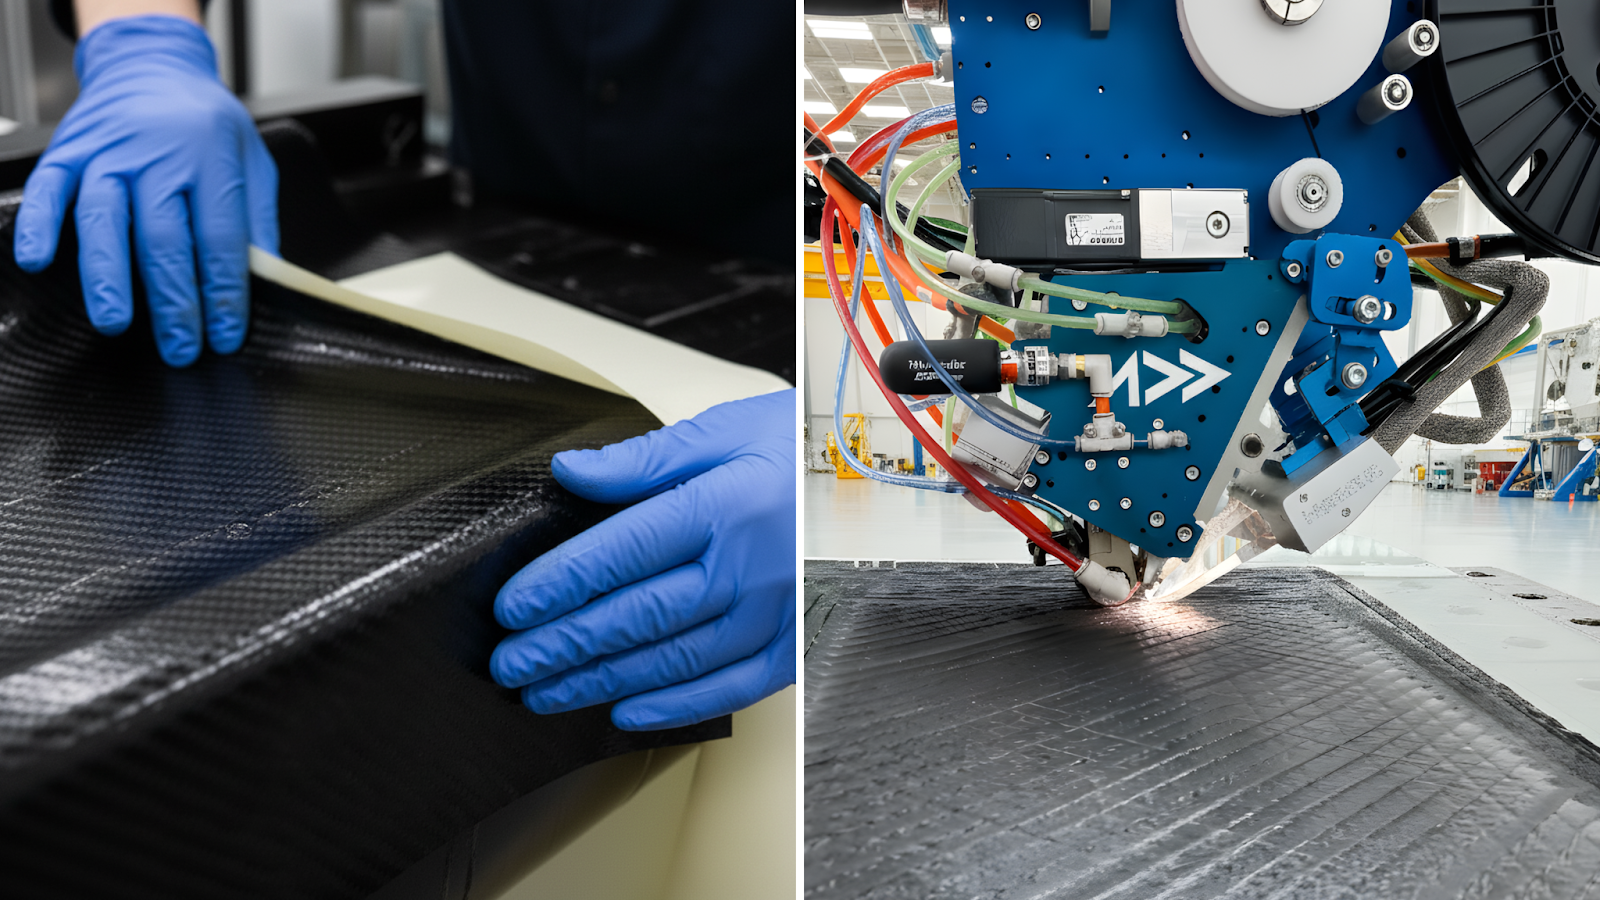
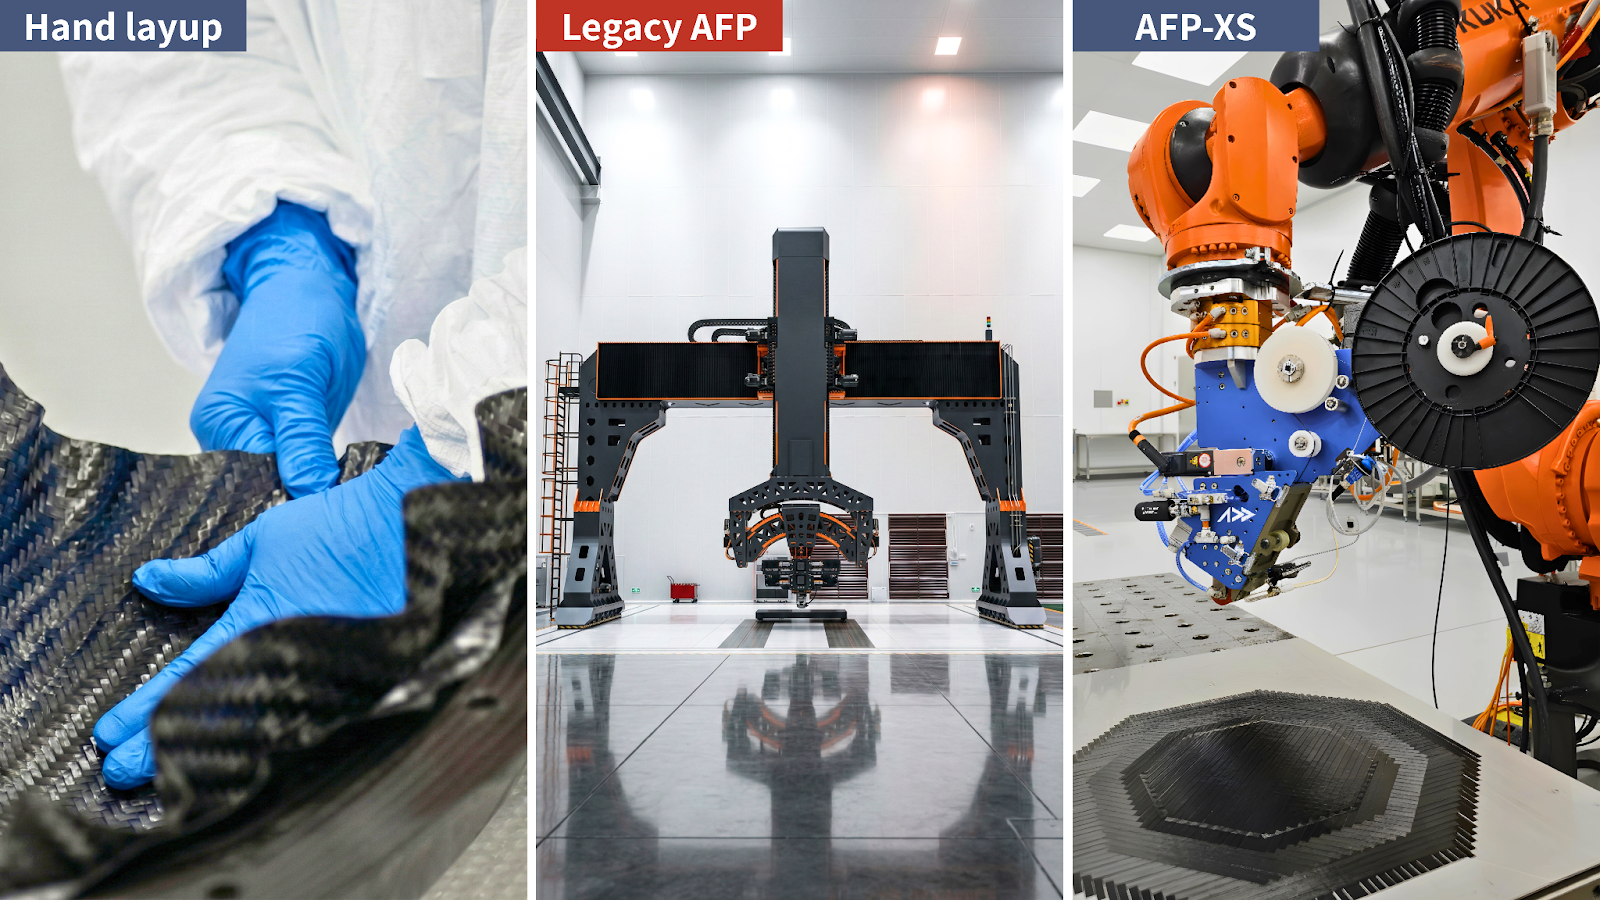
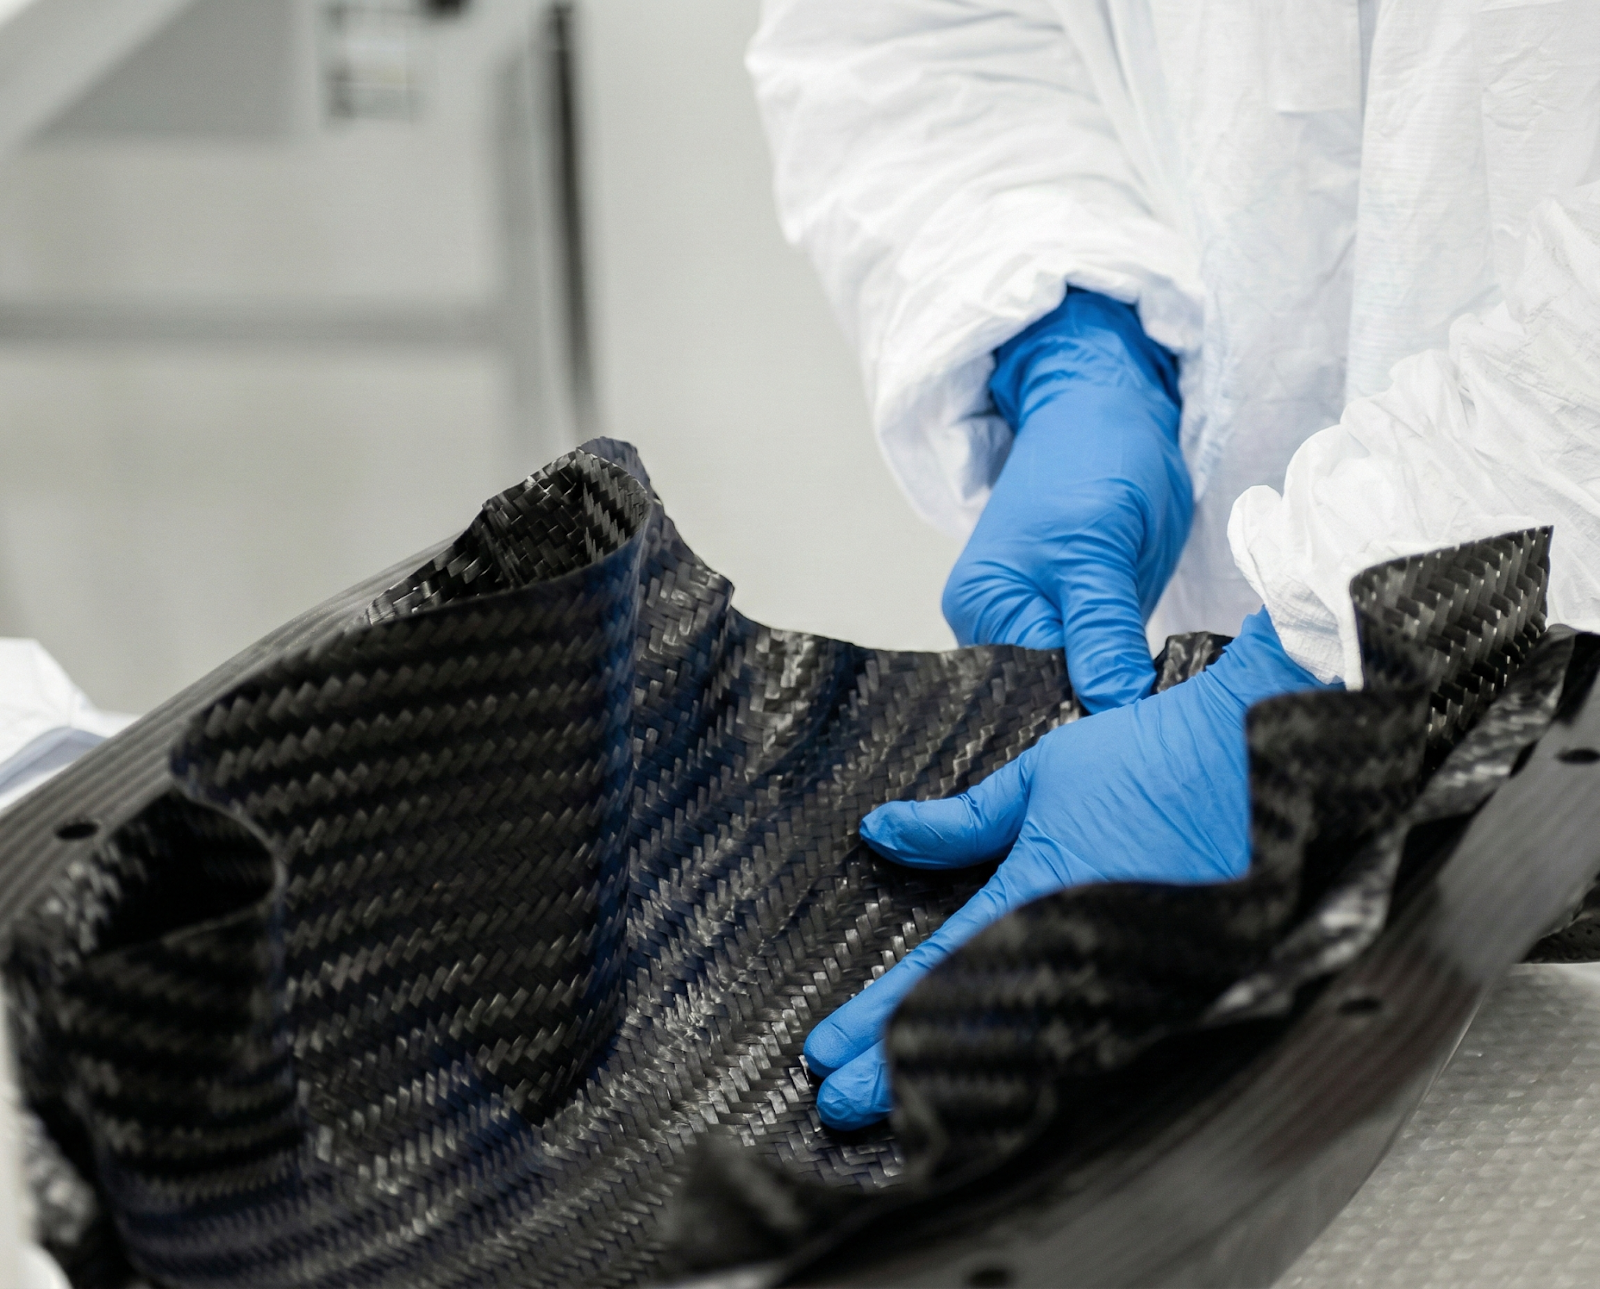
Hand layup vs. AFP-XS: same part, fraction of the cost
Every composites engineer who has tried to bring AFP automation to their organisation has had some version of this conversation:
And that's usually where it ends.
The tragedy is that this conversation is based on 20-year-old market data. The AFP market has fundamentally changed. The systems designed for Airbus and Boeing in the 1990s and 2000s — floor-mounted gantry machines, proprietary software, specialist integration teams — those are no longer the only option.
But the price assumption hasn't updated. Engineers still walk into budget conversations armed with legacy pricing, and they lose before the argument starts.
This guide exists to fix that. We're going to break down the real total cost of ownership for three composites manufacturing approaches so you can have the right conversation — with the right numbers — with the right people.
Why TCO Is the Only Number That Matters
Unit price comparisons are almost always misleading in industrial equipment. The purchase price (or monthly subscription) is just the entry point. What matters is the total cost of ownership over the usable life of the system — including every cost that appears in your P&L as a result of your manufacturing approach.
For composites, that means accounting for:
Capital and financing costs
Maintenance and support contracts
Software licensing and upgrades
Material waste and scrap
Labour (direct and indirect)
Rework and non-conformance
Floor space and facility costs
Time-to-first-part (delayed revenue)
Skills acquisition and retention
Miss any of these and your model is wrong — and the decision you make based on it may cost you far more than the number you optimised for.
The Three Models: Side-by-Side Snapshot
| Cost Element | Legacy AFP | Hand Layup | AFP-XS (Subscription) |
|---|---|---|---|
| Capital & Operating Costs | |||
| Upfront / CapEx One-time capital expenditure to acquire and install the system | €1.5M – €5M+ | €50K – €200K | €0 |
| Monthly operational Recurring operational costs per month including energy, consumables | €12K – €40K | €18K – €55K | €3,500 |
| Annual maintenance | €80K – €120K | €10K – €30K | Included |
| Software licence | €20K – €60K/yr | N/A | Included |
| Quality & Yield | |||
| Material waste rate % of raw material lost during layup process | 5% – 10% | 20% – 40% | < 6% |
| Scrap / rework rate | 2% – 5% | 15% – 30% | 2% – 4% |
| Performance & Operations | |||
| Throughput (kg/hr) Fibre deposition rate under normal production conditions | 10 – 50 kg | 0.5 – 2 kg | 2 – 8 kg |
| Operator skill floor | Specialist (high) | Medium-high | Low-medium |
| Floor space required | 100 – 400 m² | 50 – 200 m² | ~30 m² |
| Time-to-Production & Openness | |||
| Time to first part Duration from order / decision to producing the first qualified part | 6 – 18 months | Days | 4 – 8 weeks |
| Software openness | Proprietary (locked) | N/A | Open (AddPath) |
At a glance, hand layup looks cheap. Legacy AFP looks expensive. AFP-XS on subscription looks almost implausibly affordable. Let's unpack each one properly.
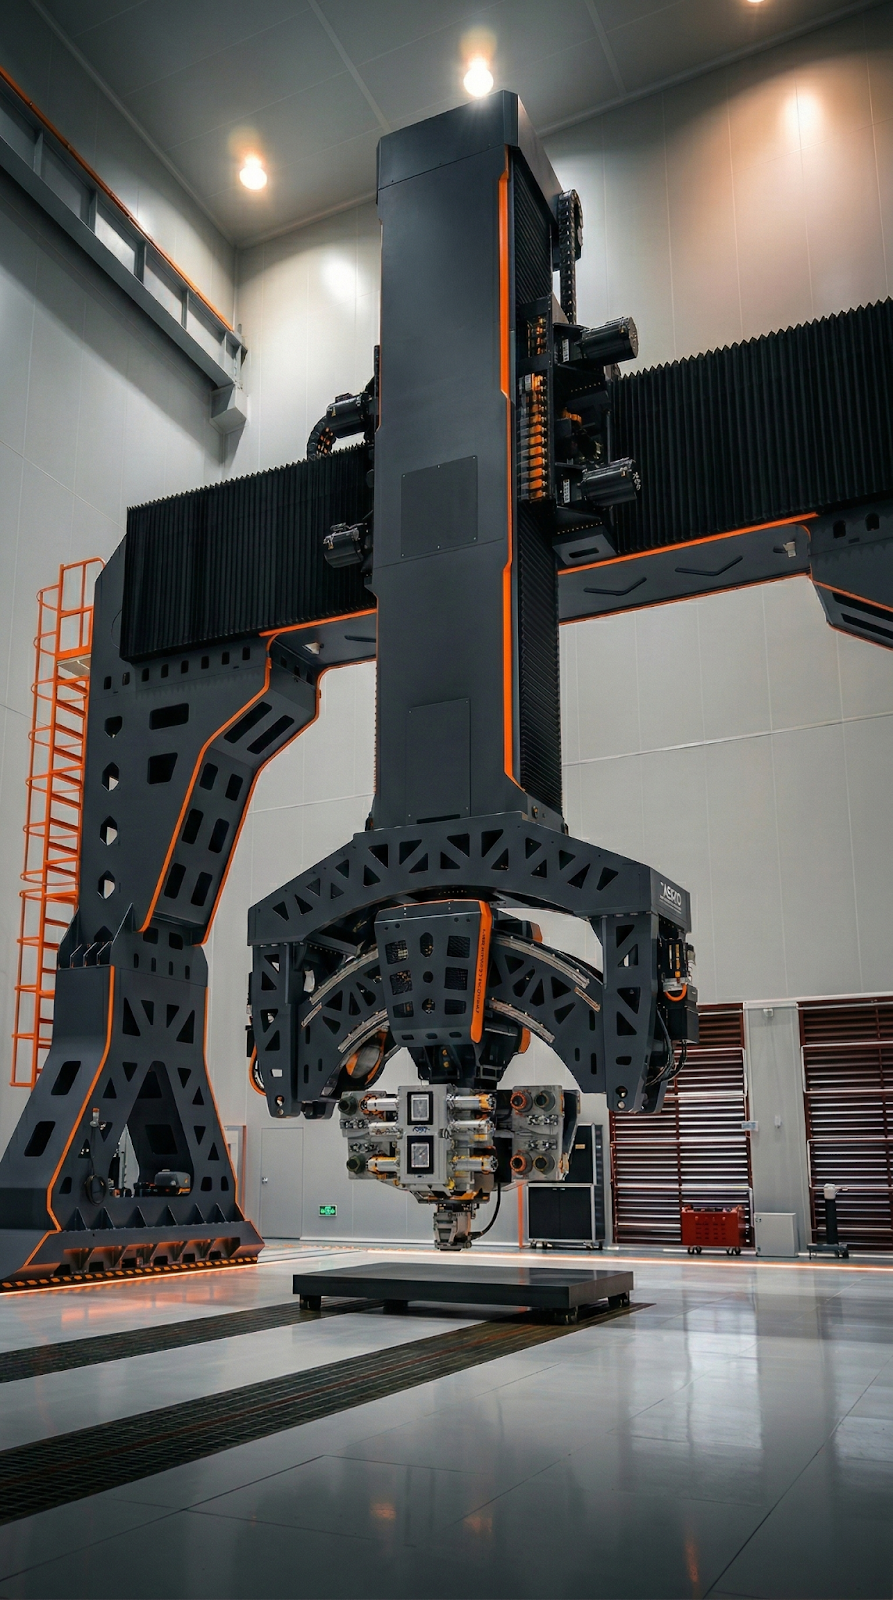
Model 1: Legacy AFP (Traditional CapEx)
Legacy AFP systems were engineered for high-volume, high-complexity aerospace programmes — think fuselage skins, wing panels, nacelle structures at A320 or 787 scale. They're exceptional machines for those applications. The cost structure reflects that.
Year 1 Cost Breakdown (mid-range system, single cell)
Beyond Year 1, the annual run cost stabilises to €200–380K per year (maintenance, software, consumables, specialist labour). That's on top of the depreciated capital.
Legacy AFP systems come with a software ecosystem that is typically proprietary. Your path planning, your material parameters, your tow steering recipes — all stored in vendor-specific formats. Changing machine vendors means re-engineering your process from scratch. This creates a switching cost that vendors understand very well, and it affects everything from support contract pricing to upgrade negotiation leverage.
Model 2: Manual Hand Layup (Your Real Baseline)
The comparison that matters most isn't AFP-XS vs. legacy AFP. It's AFP-XS vs. what you're doing right now. For most SMEs considering automation, that's manual hand layup.
Hand layup is deceptively expensive. The upfront tooling cost looks manageable. But the ongoing operational cost — particularly when you account for scrap, rework, and the compounding cost of the composites labour shortage — is brutal at scale.
Annual Cost Breakdown for a Mid-Volume Operation
(500 kg/month prepreg, €80/kg material cost)
material, and labour market
This number compounds. Every year you run hand layup, you pay it again. And because composites labour costs are rising 4–8% per year in most markets due to the skills shortage, it gets more expensive with time — not less.
The Hidden Multiplier: Scrap Rate at Scale
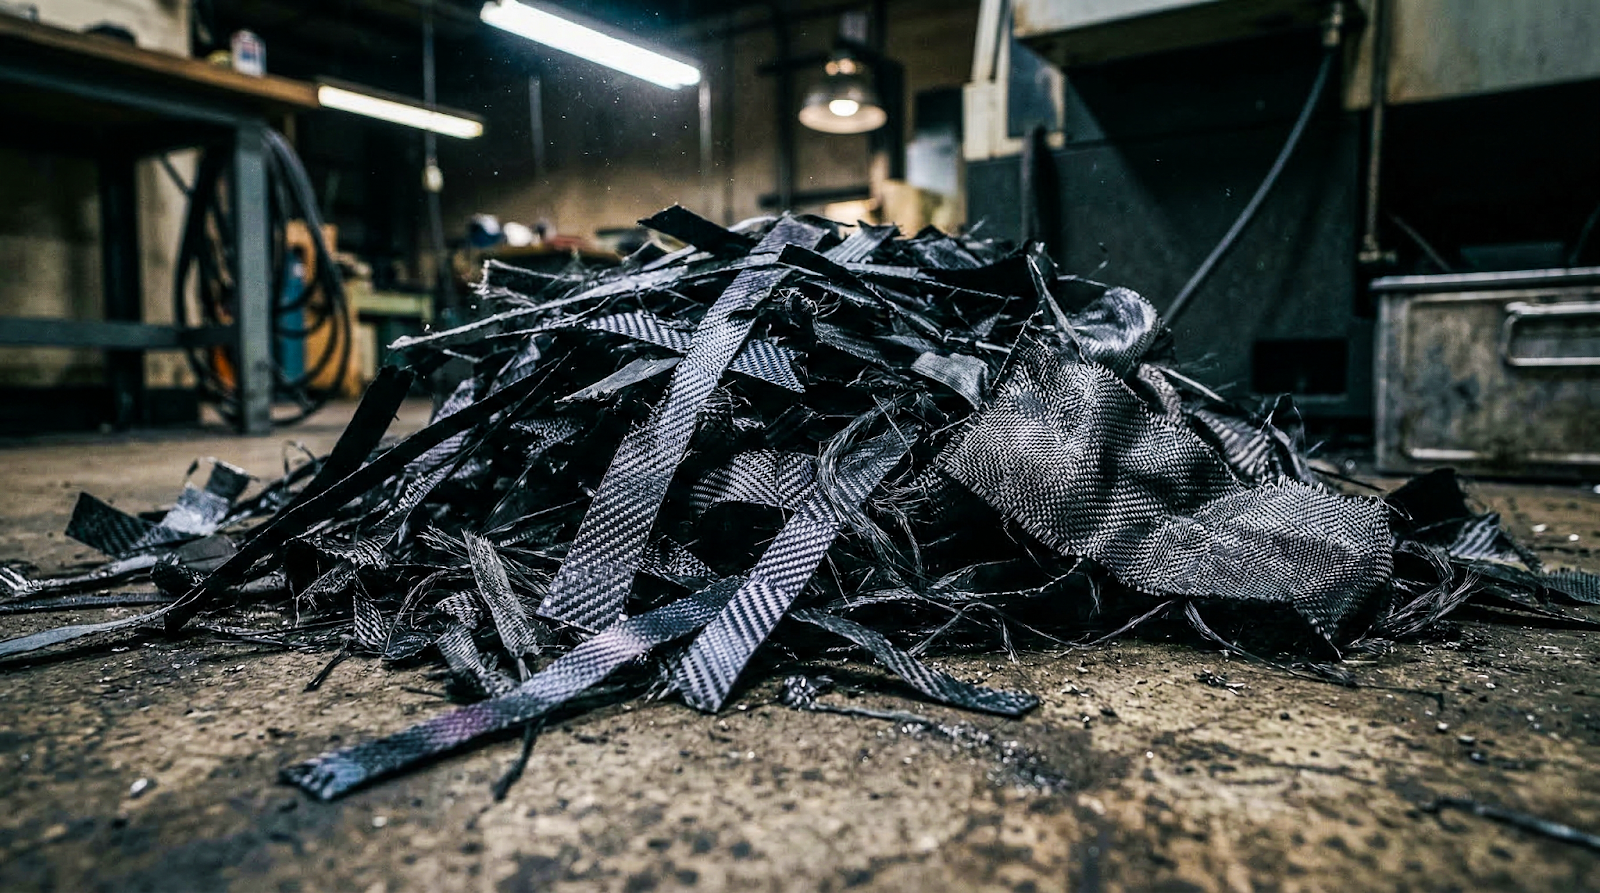
At a 22% scrap rate, you're not just wasting 22% of your material. You're wasting 22% of the labour that processed it, 22% of the machine time that supported it, and 22% of the schedule buffer around it. At €80/kg prepreg and 500 kg/month, that's €105,600 in material waste alone — per year — before you count anything else.
Model 3: AFP-XS on Subscription
AFP-XS was designed specifically to remove the barriers that have historically kept AFP out of SME budgets: CapEx, floor space, specialist skills, and proprietary software lock-in.
Year 1 Cost Breakdown
The economics work because the savings from reduced material waste and reduced rework often exceed the subscription cost in the first year — before you count any labour reallocation benefit.
The 36-Month Cumulative Cost Model
This is the model you need in front of your finance director.
Scenario Parameters
These numbers are illustrative but grounded in real material costs and typical waste rates. The actual saving depends on your specific material, volume, and labour rates — but the direction of the model holds across almost all mid-volume SME applications.
How to Build the Business Case for Your Finance Director
Finance directors evaluate capital and operational decisions on three axes: payback period, balance sheet impact, and risk. Here's how AFP-XS answers each one.
The Three Numbers That Win Budget Approval
Payback Period
AFP-XS subscription offset by material + labour savings
vs. legacy AFP: 4–8 years
Balance Sheet Impact
Subscription = fully OpEx
- No asset on balance sheet
- No depreciation schedule
- No financing required
- P&L impact begins Month 1
Risk Profile
If volume drops, subscription adjusts
- No stranded asset
- No impairment charge
- No covenant breach on debt financing
The Question Reframe
The standard framing — "Can we afford AFP?" — is the wrong question, and it almost always loses the budget argument. The right question is:
"What is manual layup costing us per year that we're treating as an unavoidable operating expense?"
When you answer that question honestly — material waste, rework, skills premium, inspection overhead — the cost of not automating becomes visible for the first time. AFP-XS doesn't look like an expense. It looks like the solution to an expense you're already paying.
The AFP Buyer's Checklist: Questions to Ask Every Vendor
Before signing anything, ask every AFP vendor these questions. The answers will tell you more than any brochure.
If a vendor can't answer these clearly, that tells you something important about the relationship you'd be entering.
Making the Right Decision for Your Application
Not every application suits every AFP approach. Here's a simplified decision framework:
| Annual Volume | Recommended Approach | Notes |
|---|---|---|
| Under 200 kg/yr | Hand layup | AFP capex unlikely to justify at this scale |
| 200 – 2,000 kg/yr | AFP-XS on subscription | ROI positive in Year 1 for most applications |
| 2,000 – 20,000 kg/yr | AFP-XS (multiple cells) or leasing | Evaluate small-footprint AFP options |
| Over 20,000 kg/yr | Legacy AFP or multi-tow systems | Evaluate with full TCO model |
Secondary Filters
Part Complexity
Material Type
Floor Space
Summary: The Real Cost of the Status Quo
The composites industry has spent 30 years treating AFP as a technology for giants. That assumption is now obsolete.
The numbers in this guide are not projections or marketing claims — they reflect real material costs, real labour rates, and real operational benchmarks. The conclusion they point to is consistent: for most SME composites manufacturers running more than 200 kg/month, the cost of not automating is significantly higher than the cost of doing it.
| Metric | Hand Layup | AFP-XS |
|---|---|---|
| 3-year total cost | ~€1.16M | ~€126K (gross) |
| 3-year net (w/ savings) | — | ~€0 (break-even or positive) |
| CapEx required | None | None |
| Balance sheet risk | None | None |
| Scrap rate | 15–30% | 2–5% |
| Material waste | 20–40% | <6% |
| Operator skill floor | High | Low-medium |
| Software lock-in | N/A | None (open) |
| Time to first part | Today | 4–8 weeks |
The question is no longer whether AFP is affordable. For most SME composites manufacturers, the question is how much longer you can afford not to have it.
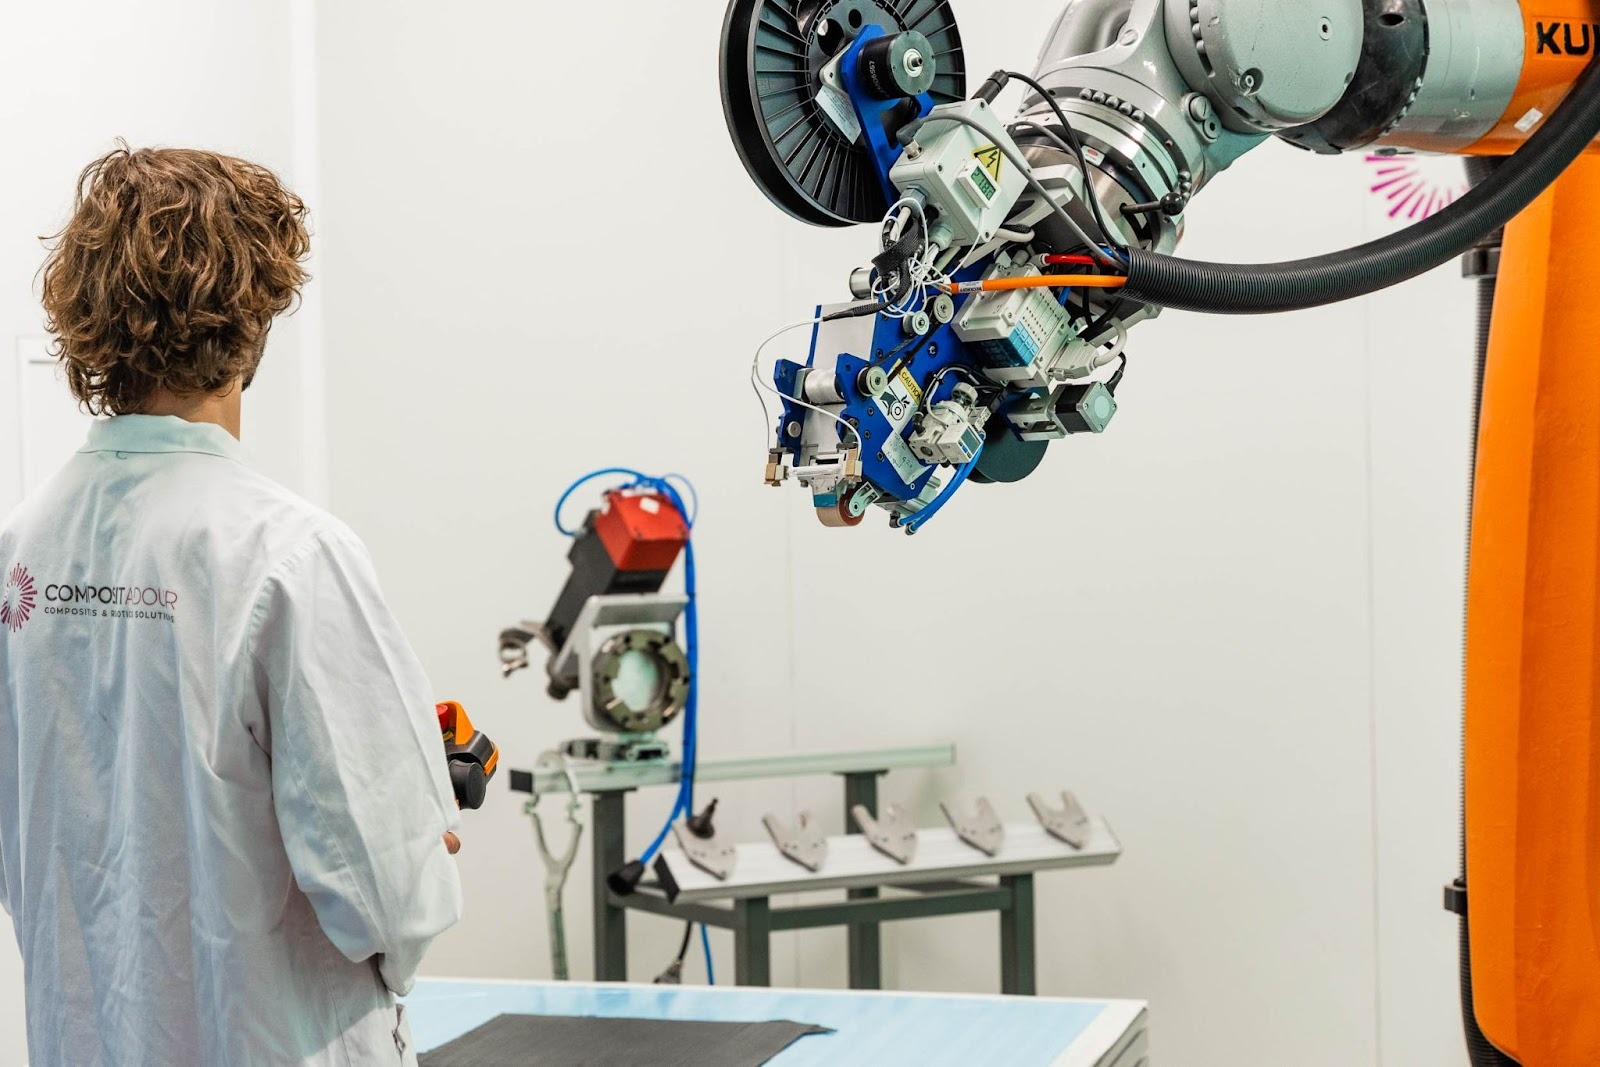
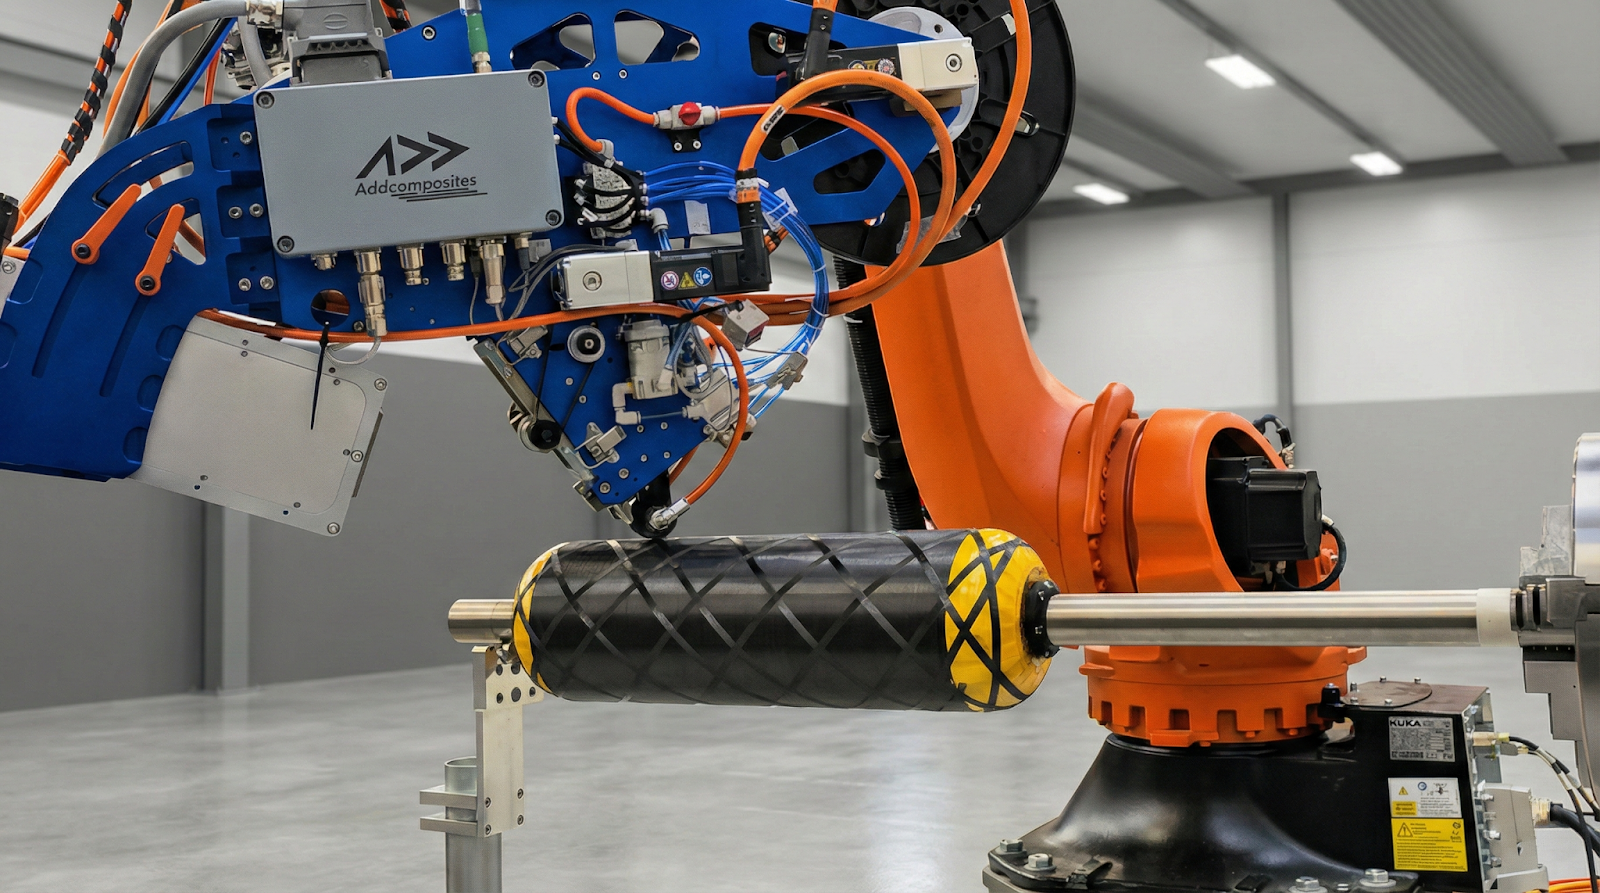
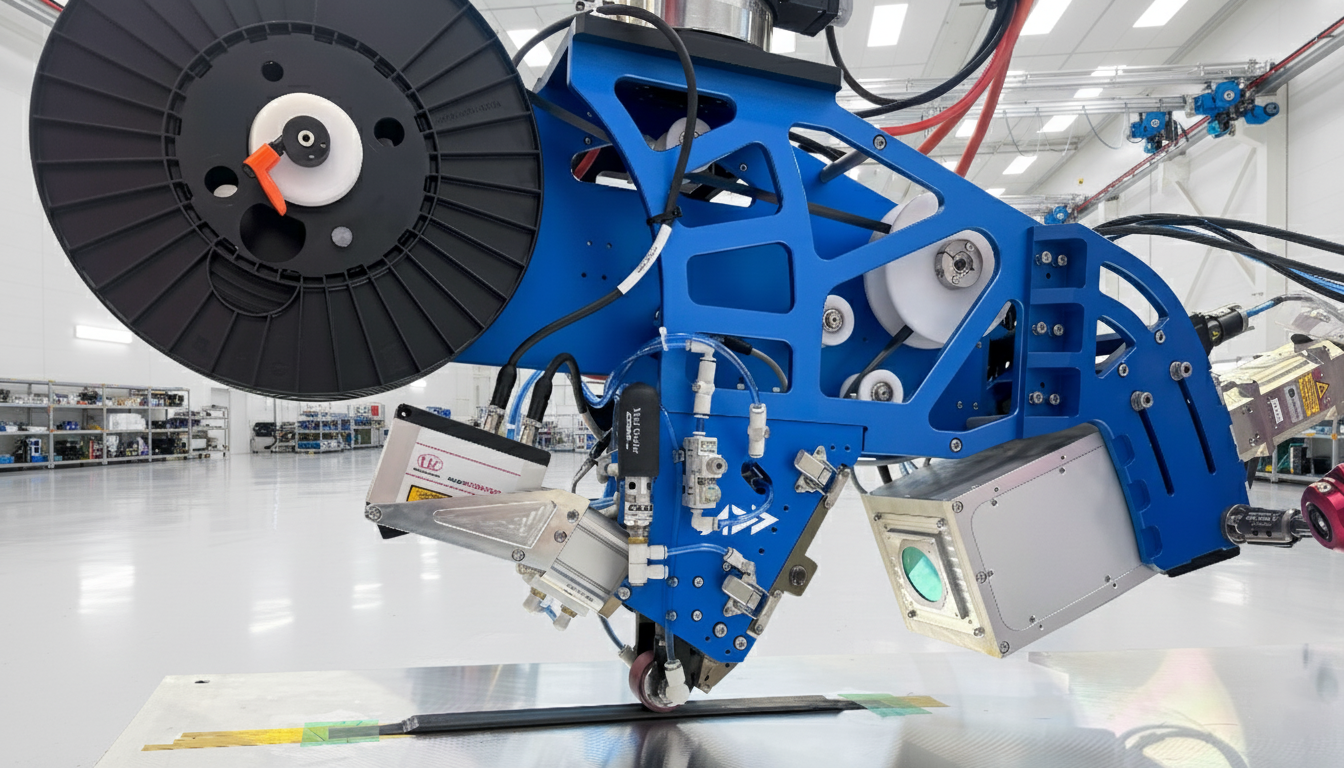
Image courtesy of Compositadour — AFP-XS by Addcomposites in operation at their facility.
Next Step: Run the Numbers for Your Application
The model above is built on industry-standard assumptions. Your numbers will be different — your material cost, your throughput, your current rework rate.
We offer a free 30-minute TCO walkthrough where we build the model with your actual production data. No commitment, no sales pitch — just your numbers, worked out honestly.
References
Market sizing, CAGR projections (6–14%), and adoption trends for automated fibre placement and automated tape laying systems globally.
https://www.360iresearch.com/library/intelligence/afp-atl-machinesIndustry outlook covering thermoplastic AFP adoption, skills shortages, and the democratisation of composites automation for mid-tier manufacturers.
https://www.compositesworld.com/articles/composites-trends-to-watchAnalysis of the composites workforce gap, retirement wave impacts, and how automation is being used as a strategic response to skills scarcity.
https://www.plataine.com/blog/labor-shortage-composites-manufacturingSurvey data on composites laminator wage premiums, recruitment difficulty, and projected workforce shortfall in the UK and European composites sector.
https://compositesuk.co.uk/resources/workforce-surveyConference presentation data on AFP-XS installation base, material compatibility benchmarks, and waste rate comparisons vs. hand layup.
https://www.jeccomposites.com/jec-world/Announcement of the world's largest thermoplastic composite press installation at Airbus Broughton, signalling the industry's shift toward thermoplastic AFP at scale.
https://www.airbus.com/en/newsroomMarket sizing for thermoplastic composites at USD 14.3B by 2031, driven by aerospace structural applications and AFP process adoption.
https://www.marketsandmarkets.com/Market-Reports/thermoplastic-composites-marketInternal technical benchmarks for AFP-XS including material waste rates (<6%), throughput ranges (2–8 kg/hr), installation footprint, and AddPath software capabilities.
https://www.addcomposites.com/afp-xsEuropean composites market data including production volumes, SME share of the supply chain, and automation investment trends.
https://eucia.eu/resources/sector-reportsBenchmark data on hand layup non-conformance rates, rework cost multipliers, and inspection overhead as a percentage of part cost.
https://www.nist.gov/manufacturingLearn More
Ready to run the real numbers for your application? Book a free 30-minute TCO walkthrough with our team.
Book a TCO Walkthrough